Process Performance Index (Ppk)


O'PEEP'S PPK EXPLANATION 

Imagine you have a rather big car which you park in your rather tiny garage. Does this occasionally result in scratching your door panels? Sometimes you are closer to one wall or to the other? Cpk and Ppk both tell you how capable you are to park your car centered between the garage walls. While Cpk looks at how you may impress a bystander just this afternoon, the Ppk value looks at the likelihood of a scratch in the long-term, e.g. considers the ground being icy in winter times.

look inside elearning  


The Ppk Index compares the distance from the process center to the nearest Specification Limit and to the process spread.

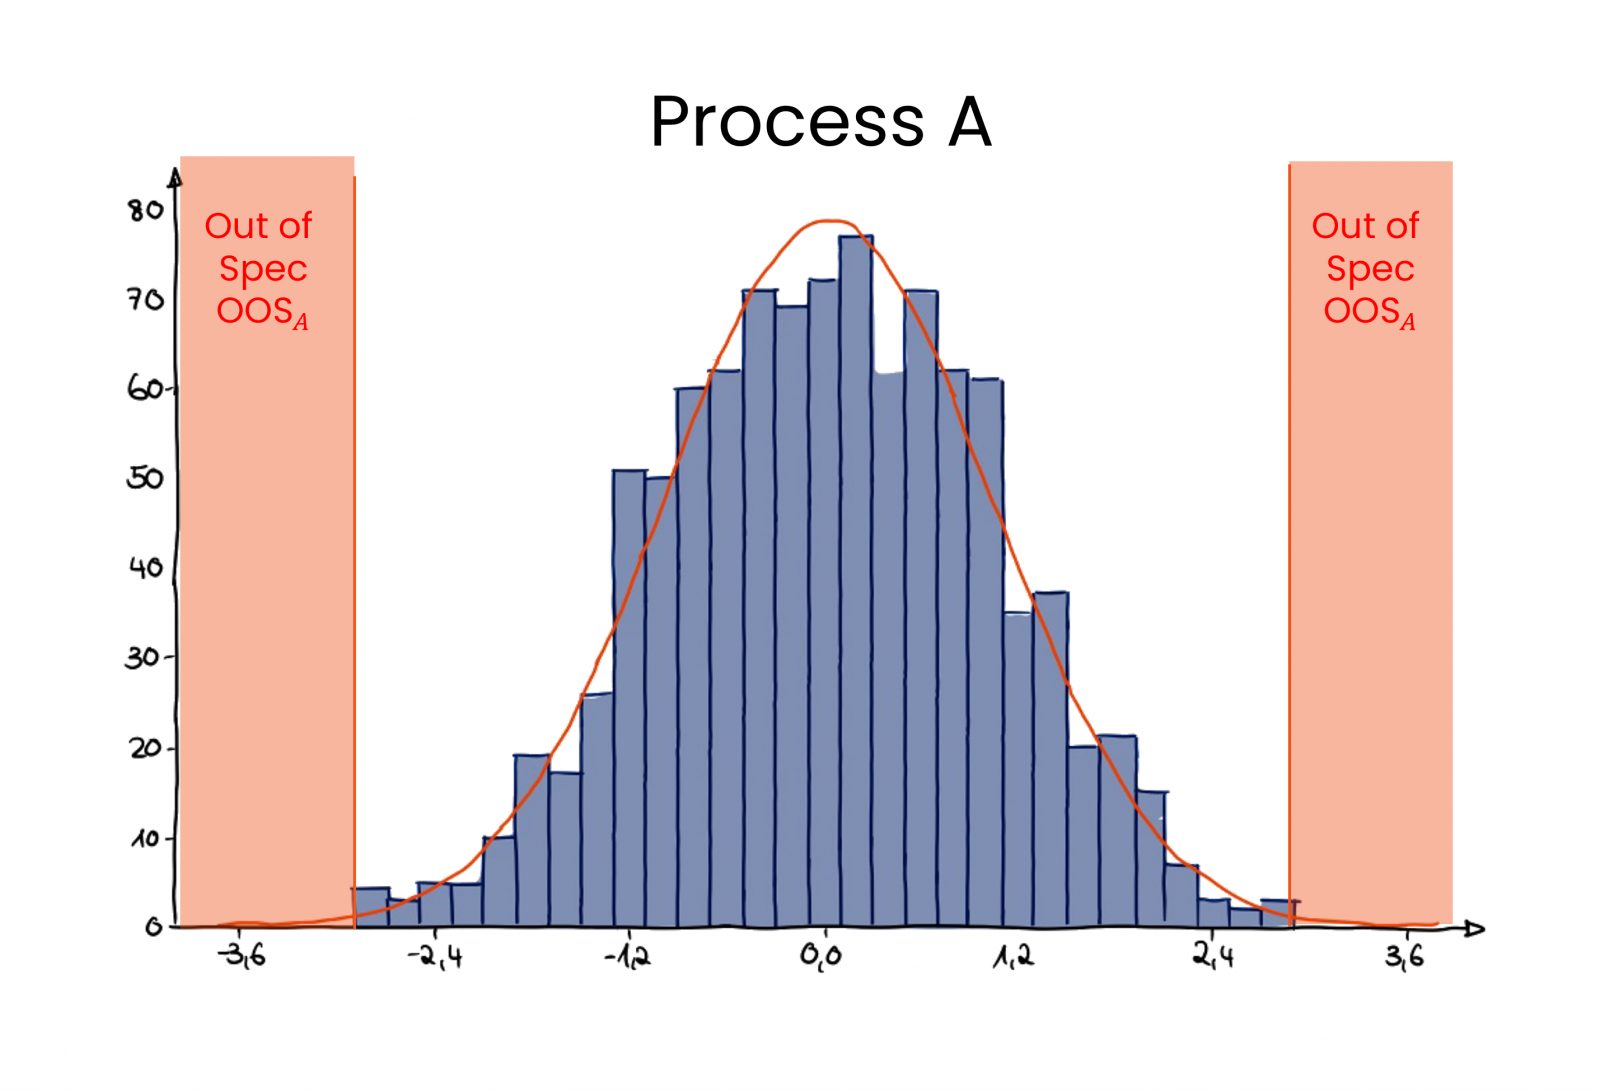
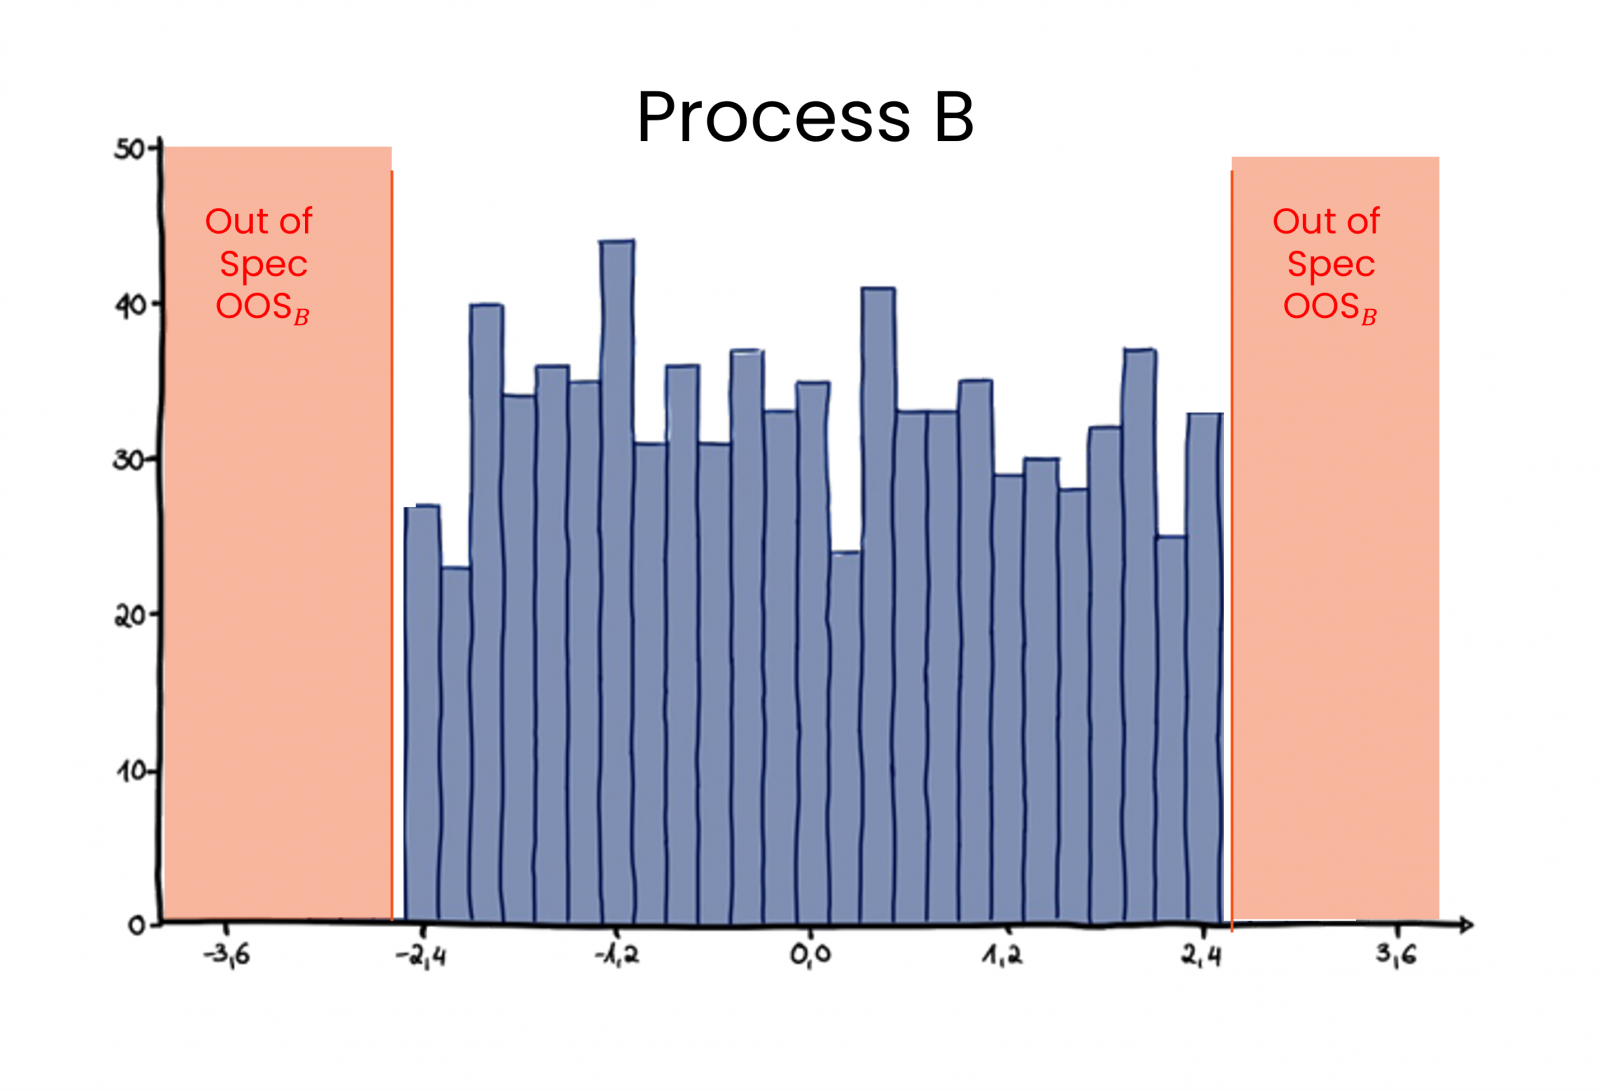
The greater the Ppk, the better the process fits between the specifications. The underlying concept is that a process which is “more on target” is more capable than a process that is wider distributed. Have a look at the two processes below. Process A is better than Process B even though through sorting you have the same number of “Out of Specification events” in both processes. 

UNDERSTANDING PPK

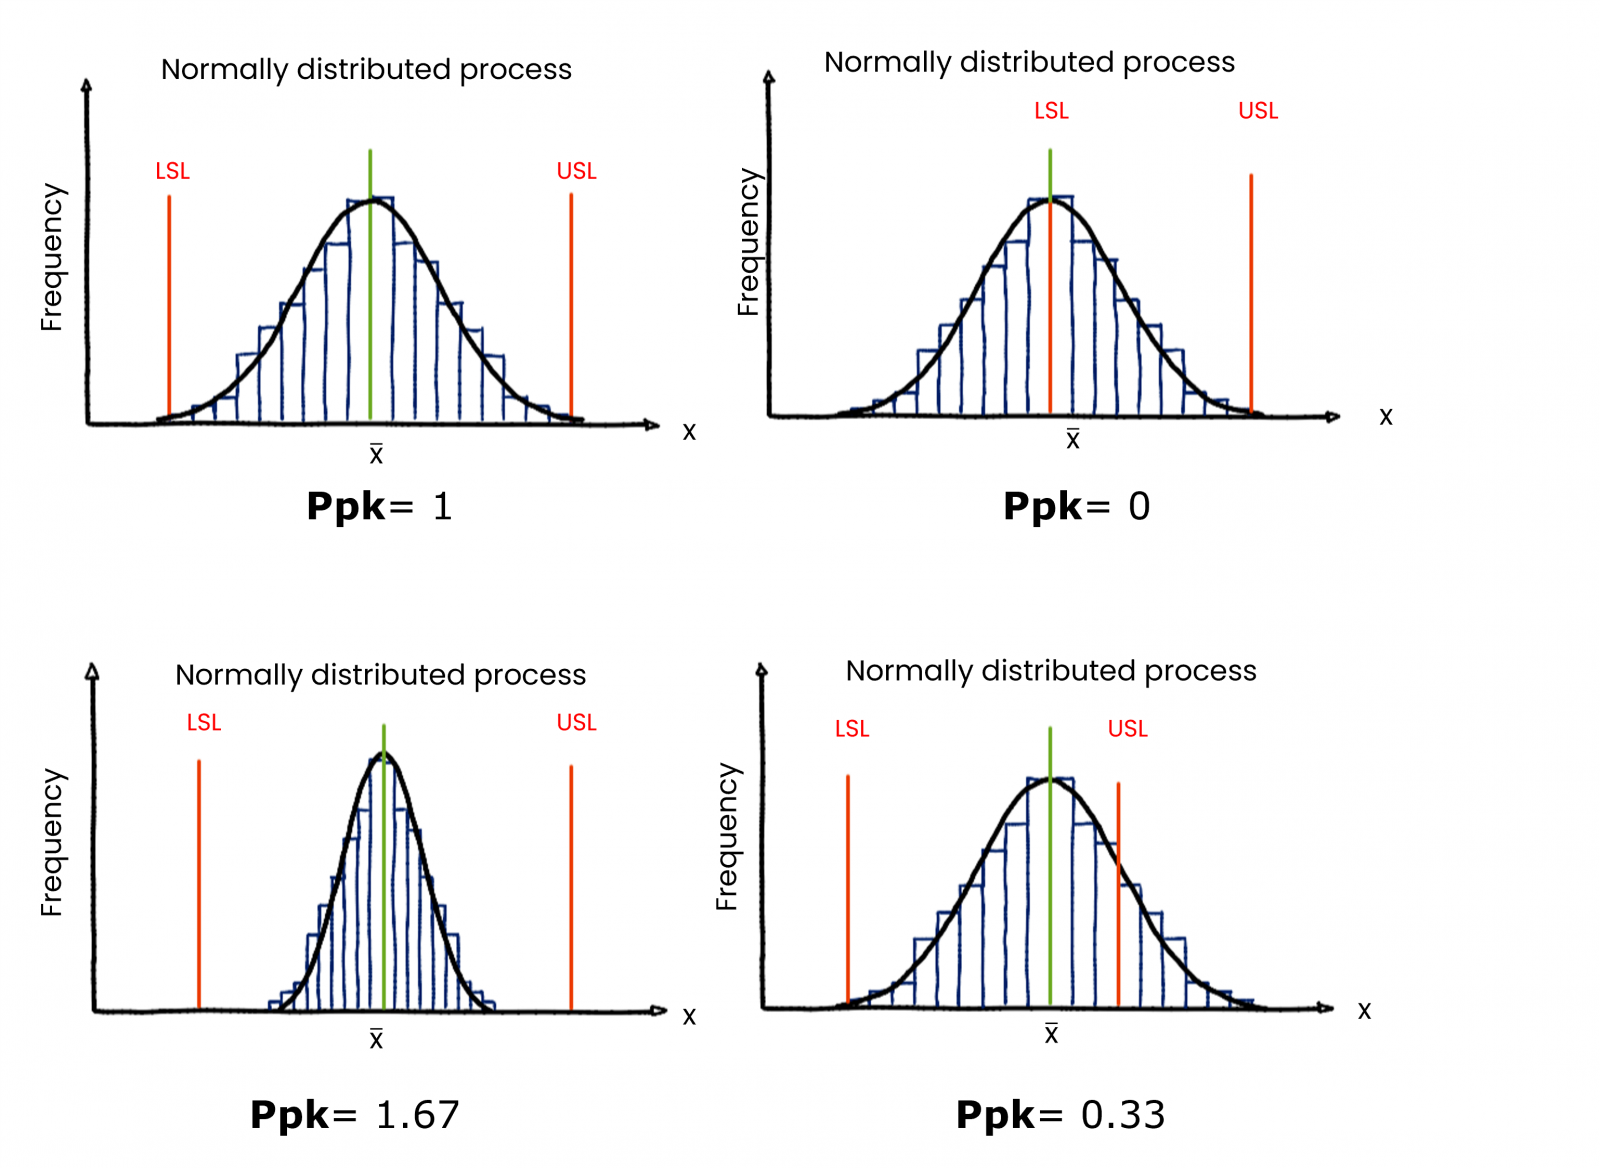
This graph on normal distribution, the Gauss curve, explains what is what in process capability.  Find an example to calculate Cpk.

As you can see in the graphs, Ppk varies depending on where the center of the distribution is with respect to the specification limits but also depending on the spread (standard deviation) of the distribution:

  • The closer to the center of the specification limits, the better the Ppk. 
  • The less spread, the better your Ppk.

These normal distribution graphs visualize process capability depending on the spread of distribution and specification limits, upper and lower spec limit.

WHAT PPK STANDS FOR

"Pp" stands for Process Performance whilst the "k" comes from Japanese and means "Katayori" which is bias.

PPK, PROCESS YIELD, SCRAP RATES, PPM

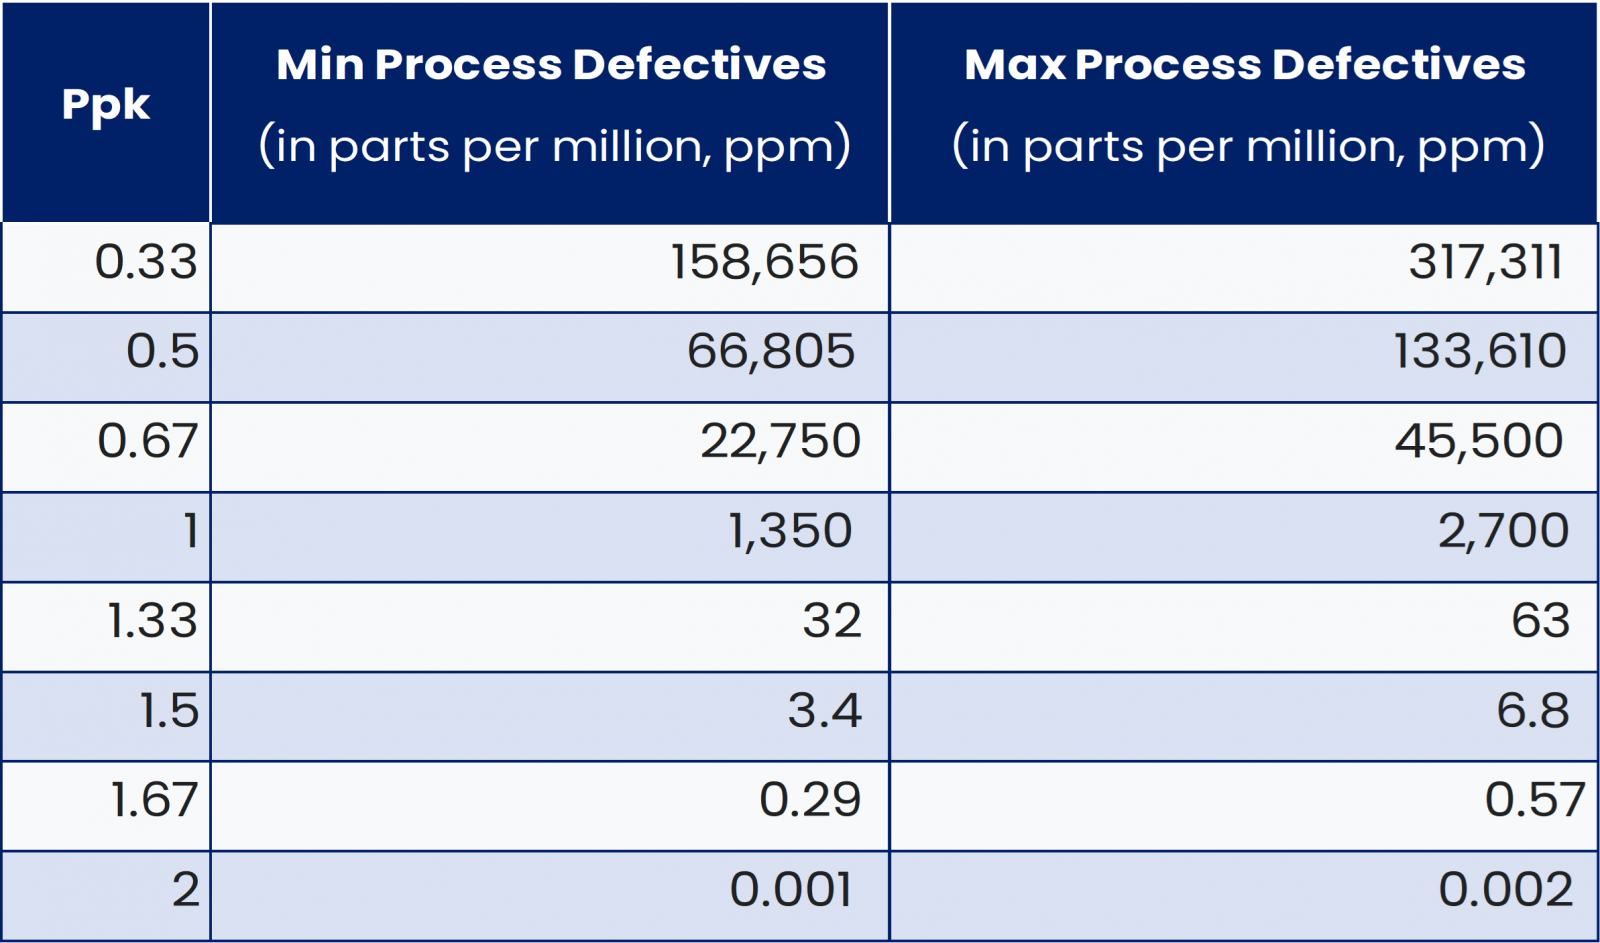
If a process is normally distributed, Ppk and process yield are linked. The metrics process yield and scrap rate are also measures for process capability. You typically find them expressed in percent or ppm (parts per million). 
For example, a Ppk of 1.33 means that less than 0.01% of the total production is scrap. See our table below. 


Cpk correlates with process yield which correlates with DPMO. You can convert Cpk to process yield. Use this table.


ASSUMPTIONS OF THE PPK

  • Data is representative of the process
  • The process is stable (no special causes)
  • Data is normally distributed

HOW TO CALCULATE PPK

Calculate Cpk Critical process capability. Use this formula. The equation is about Lower and Upper Specification Limit.

CPK vs PPK

Click here to learn more about the differences.

FOR MINITAB USERS

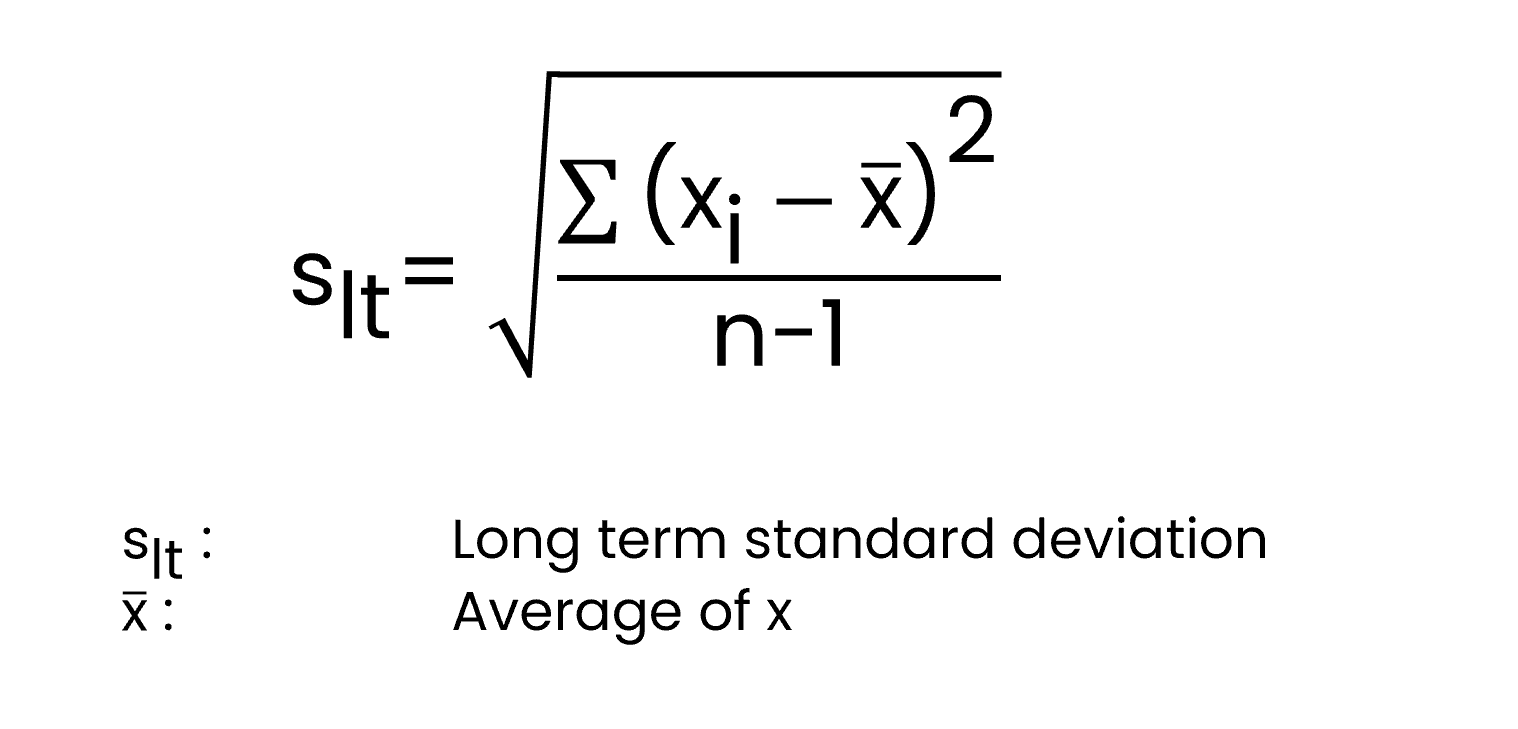
In practical application, statistical software does not ask if your process data is long- or short-term. Thus e.g. Minitab is estimating long-term variation from your data by using:


Join our next Green Belt Training to get certified in systematic process improvement.

Join the open green belt  


Join our next Black Belt Training to get ready to lead the improvement.

Join the open black belt